A Comparison of Prescriptive Fitting Algorithms and Beamforming Technology for Two Different Manufacturers

A fundamental concept in fitting hearing aids is to provide the optimum gain and output across frequencies for each patient. Most commonly, the prescribed gain and output is based on the patient’s hearing thresholds. Over the years we have seen prescriptive fitting methods that have ranged from suggesting gain that was 1/3 of the hearing loss, to methods recommending gain roughly ½ of the hearing loss, to the approach of “mirroring the audiogram” (gain equal to the hearing loss). Today, we have a good understanding of the appropriate gain related to hearing loss, and we have two validated and commonly accepted prescriptive fitting methods: the National Acoustic Laboratories Non-Linear version 2 (NAL-NL2), and the Desired Sensation Level version 5 (DSLv5). These methods provide a prescription for input-specific gain and output across frequencies based on the patient’s hearing thresholds and predicted (or measured) dynamic range.
When prescriptive fitting methods are developed, it is of course important to consider the primary input signal of interest for hearing aid users – speech. Considerable research has been devoted to obtaining an understanding of the magnitude and spectrum of average speech, referred to as the long-term average speech signal, or LTASS. It is important to consider, that while hearing aids are used around the world to understand hundreds of different languages, nearly all the research regarding the LTASS has been with the English language. One might ask, is the LTASS different for different languages, and if so, should the prescriptive fitting targets then also be different?
In the 1990s, research was conducted at the National Acoustic Laboratories which studied the LTASS and some dynamic characteristics of speech in 12 different languages.1 Speech samples of each language were recorded for 10 male and 10 female talkers. They reported that in general, the LTASS was relatively similar for all languages. There were, however, many statistically significant differences, but these differences were small and not always consistent for male and female samples of the same language. These authors suggested that a "universal" LTASS would be applicable, that could be used across languages for many purposes, including use in hearing aid prescription procedures. This universal LTASS, referred to at the ILTASS (“I” for “international”), has been used in generic prescriptive methods, and also by individual manufacturers when they develop their proprietary fitting algorithms.
While the ILTASS is commonly used to determine prescribed gain, there has been some question whether a modification is needed for tonal languages that are commonly found across the Asian and African countries, as low frequencies may be somewhat more important in these languages than they are in the English language. When viewed in terms of prescribed gain, however, these differences are small, and maybe are not present at all when significant venting is introduced, such as in today’s popular open fittings.
Presently, two major manufacturers take opposing viewpoints regarding the modification of prescriptive fittings for tonal languages: one manufacturer uses the same algorithm for all languages based on the ILTASS, the other manufacturer has a specific fitting algorithm for tonal languages. Both of these manufacturers have products which have a bilateral beamforming algorithm, designed to enhance speech originating in front of the listener when surrounded by background noise. The purpose of this research, therefore, was to evaluate the two different prescriptive approaches, using both speech recognition and subjective ratings, for each manufacturer’s respective technology for a group of participants who speak a tonal language (Mandarin).
Methods and Procedures
Participants: The participants were 20 adults (10 male/10 female) with bilaterally symmetrical downward-sloping sensorineural hearing loss. The mean audiograms for the right and left ear are shown in Figure 1. The average age was 58.3 years (range = 24 to 81 years). All participants were experienced users of bilateral hearing aids.
Figure 1. Mean audiogram for the left and right ears of the 20 participants.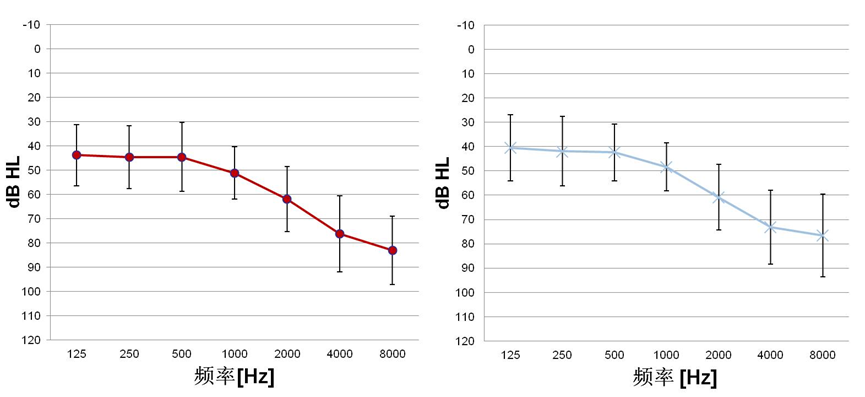
Hearing Aids: The hearing aids were the premier model (mini-BTE RIC) for both Manufacturer A and B. All participants were fitted bilaterally. The hearing aids were programmed using the current software; all special features except frequency lowering were activated, and set at the manufacturer’s default settings. The hearing aids were coupled to the ear using the manufacturer-specific domes; the tightness of fit was selected based on the participants’ low-frequency hearing loss. Manufacturer A products were programmed to their proprietary fitting algorithm, and Manufacturer B products were programmed to their fitting algorithm recommended for use for tonal languages. These two products were compared using speech-in-noise recognition testing, and also using subjective ratings of different speech material.
Procedures for Speech Recognition: All testing was conducted in a large sound-treated booth. The participant sat at the center of the room, surrounded by 8 loudspeakers, each a distance of 2 meters from the listener. The loudspeakers were positioned at 0°, 45°, 90°, 135°, 180°, 225°, 270°, and 315° azimuth (see Figure 2). The speech material used was the Mandarin Speech Test Materials (MSTMs) developed by Tongren Hospital in China. This speech material includes 25 test lists of 10 sentences each, and 1 practice list of 5 sentences. The target speech signal was presented from the loudspeaker at 0°, and the background competing signals were presented from the other seven loudspeakers, with the overall level fixed at 65 dBA. The background competing signals were also sentences of the MSTM, presented uncorrelated from the 7 loudspeakers, with the gaps between sentences removed. That is, while the target Mandarin speech was presented, the listener would also be presented seven other different Mandarin speech sentences.
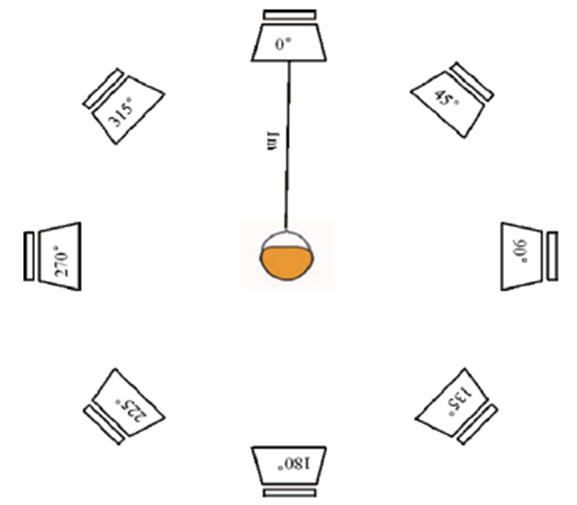
Figure 2. Loudspeaker arrangement used for the speech-in-noise testing. The target sentence was delivered from the loudspeaker at 0 degree, with competing speech originating from the other 7 loudspeakers.
By altering the intensity of the target speech, an adaptive approach was used to determine each individual’s speech-in-noise threshold. Each participant was given 20 sentences for each test condition. The participants were tested, fitted bilaterally, with each manufacturer’s instruments programmed to omnidirectional (with pinna compensation), and to the narrow beamforming algorithm. The order of manufacturer was counterbalanced among participants.
Procedures for Subjective Ratings: This portion of the testing also was conducted in a standard sound treated booth. Two loudspeakers were used to present the speech (and noise) signals, positioned at +30° and −30° azimuth relative to the participant, who was seated 2 meters away in the center of the test field. Ratings for speech clarity, sound quality and overall preference were obtained for five different listening conditions (all Chinese speech): Male in quiet (65 dB SPL), Female in quiet (65 dB SPL), Male in multi-talker babble (SNR = +5 dB), Female in multi-talker babble (SNR = +5 dB) and Conversational speech (male and female) in traffic noise (SNR = +5 dB). Loudness ratings also were obtained for the conversational speech-in-traffic listening task.
For all ratings, an eleven point, 0−10 rating scale was used. For the speech clarity ratings the end-points were 0 = Not Clear At All and 10 = Very Clear. For the sound quality the end-points were 0 = Very Poor Sound Quality and 10 = Excellent Sound Quality. Overall impression was rated from 0 = Very Poor and 10 = Excellent. On the 0−10 Loudness rating chart, 0 = Very Soft, 5 = Just Right, and 10 = Very Loud. The hearing aids were programmed the same as for the speech recognition testing; the order of testing was counterbalanced for the two different hearing aid models.
Results
Speech Recognition
For the speech recognition portion of the study, the signal-to-noise ratio scores (dB) required to achieve 50% correct for the MSTM are displayed in Figure 3. These scores were analyzed using analysis of variance (ANOVA) with two between-subjects factors, hearing aid brand (Manufacturer A, Manufacturer B) and hearing aid directional setting (omnidirectional and narrow beamforming). Results revealed a significant main effect of manufacturer (p < 0.05), and a significant main effect of directional setting (p < 0.05). Multiple pair-wise comparisons controlling for family-wise error rate with Bonferroni adjustments were used as follow-up analysis of the significant main effect of directionality. Results revealed that performance for both manufacturers was significantly better in the narrow beamforming setting, than for omnidirectional (p < 0.001). These results also suggest that performance was better with Manufacturer A than with Manufacturer B (difference of means: 0.74 dB), although there was no significant interaction between brand and directionality. That is, both manufacturers provided similar directional benefit, but overall performance was better with Manufacturer A (see Figure 3).
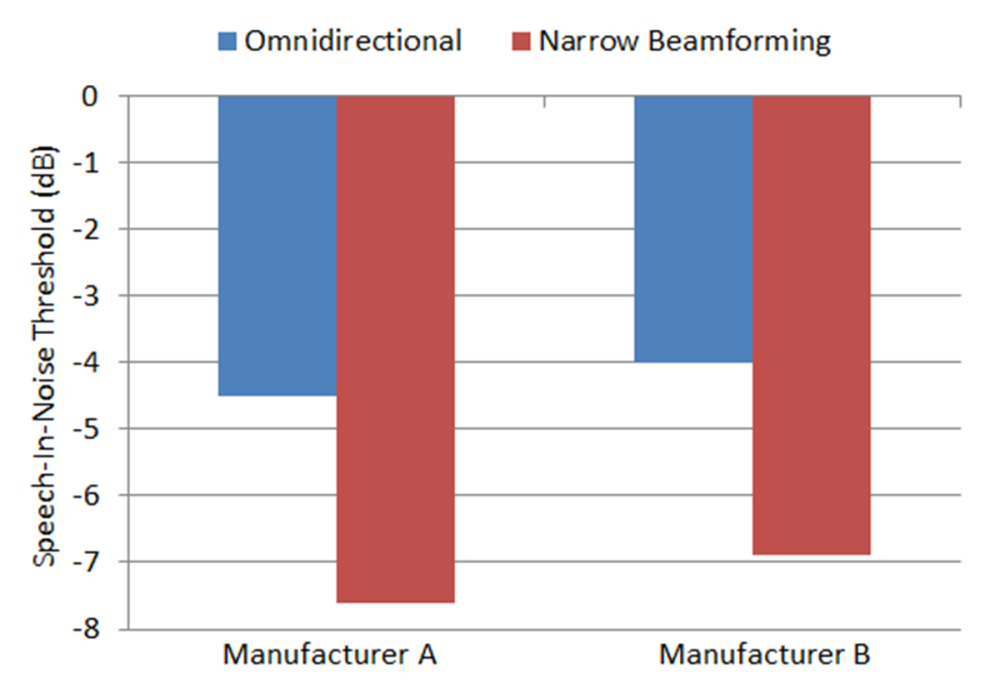
Figure 3. Mean SRT-in-noise performance for the two different products at the two different hearing aid settings: omnidirectional (with pinna compensation) and binaural beamforming.
Subjective measures were obtained for five different sound samples, comprising the participants’ ratings of speech clarity, sound quality, loudness and overall impression. These ratings were analyzed separately, each with an analysis of variance (ANOVA). Each ANOVA included two within-subject factors, hearing aid manufacturer and stimulus (male, female, male in noise, female in noise, conversation in noise). In all cases, the assumptions of sphericity were violated, so the degrees of freedom were adjusted using Huynh-Feldt corrections to compensate for the violations. Significant main effects were explored statistically using multiple pairwise comparisons and Bonferroni corrections to control for family-wise error rate. If the hearing aid manufacturer by stimulus interaction was significant, the effect of hearing aid manufacturer was explored separately for the speech in quiet and speech in noise stimuli. To do this, the male and female scores were averaged to obtain a single “speech in quiet” score and the male in noise, female in noise, and conversation in noise scores were averaged to obtain a single “speech in noise” score.
Speech Clarity and Sound Quality
The mean ratings for Speech Clarity and Sound Quality are shown in Figures 4 and 5. While these are different attributes of hearing aid performance, observe that the ratings are very similar. In general, the clarity versus quality ratings did not different by more than 0.5 on the 0−10 rating scale for any listening sample, and we see a consistent preference for Manufacturer A.
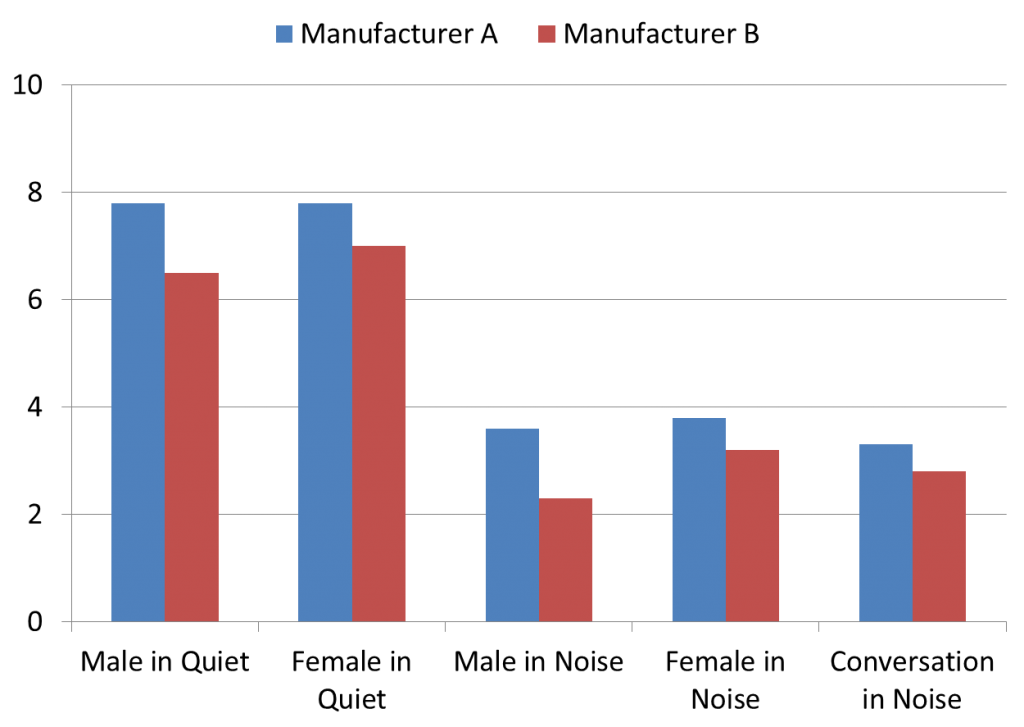
Figure 4. Mean subjective ratings of speech clarity for five different listening conditions, for the products of Manufacturer A and Manufacturer B. Ratings obtained using a 0−10 scale (0 = Not Clear At All and 10 = Very Clear).
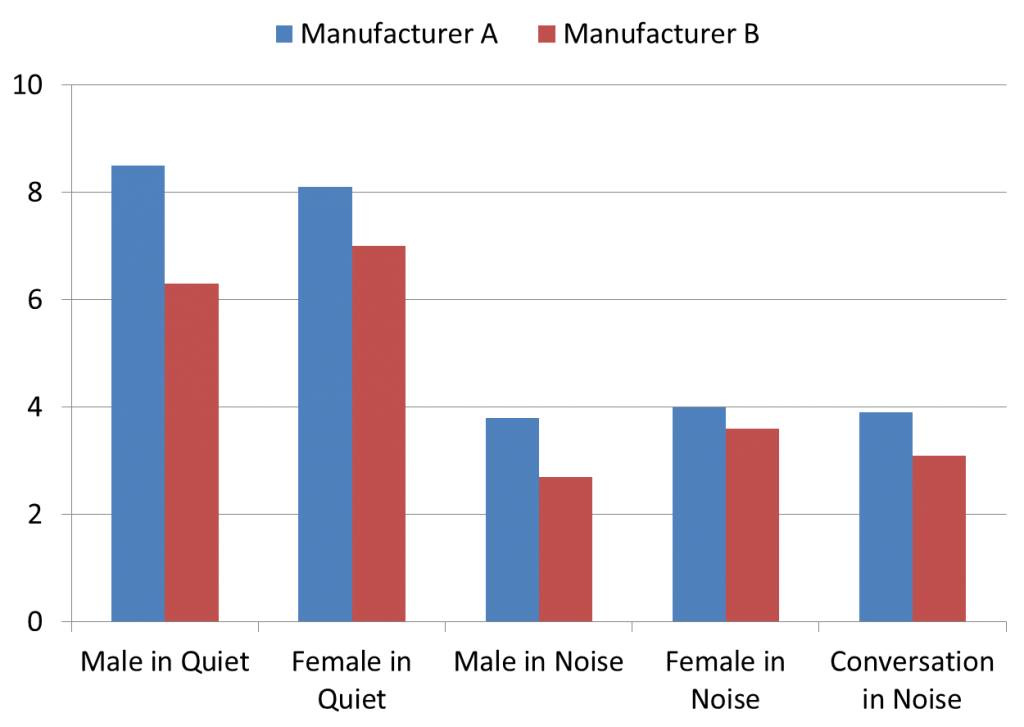
Figure 5. Mean subjective ratings of sound quality for five different listening conditions, for the products of Manufacturer A and Manufacturer B. Ratings obtained using a 0−10 scale (0 = Very Poor Sound Quality and 10 = Excellent Sound Quality).
The statistical analysis for both clarity and quality was very similar and therefore summarized together. Analysis for both subjective attributes revealed a significant main effect of hearing aid manufacturer (p<.01) and a significant main effect of stimulus (p < 0.001). The hearing aid manufacturer by stimulus interactions were not significant. Multiple pairwise comparisons to explore the significant effect of hearing aid manufacturer revealed that Manufacturer A resulted in higher ratings of both speech clarity and sound quality. Multiple pairwise comparisons to explore the significant stimulus effect revealed that ratings were significantly higher with the speech in quiet stimuli (male and female) than with each of the speech in noise stimuli (male in noise, female in noise, conversation in noise; p < 0.001). However, the speech in quiet stimuli were not different from each other (p = 1.0) and the speech in noise stimuli were not different from each other (p> 0.5). In total, these results suggest that subjective ratings of speech clarity and sound quality were higher for the speech in quiet stimuli than for the speech in noise stimuli, and higher for Manufacturer A than for Manufacturer B. However, the manufacturer difference was independent of stimulus type.
Loudness
Average subjective loudness ratings are displayed in Figure 6. Recall that for this 10-point chart, 0 = very soft, 5 = just right, and 10 = very loud. Note a consistent trend in mean performance for Manufacturer B to be rated with higher loudness for all listening samples, with Manufacturer A falling closer to the desired #5 rating.
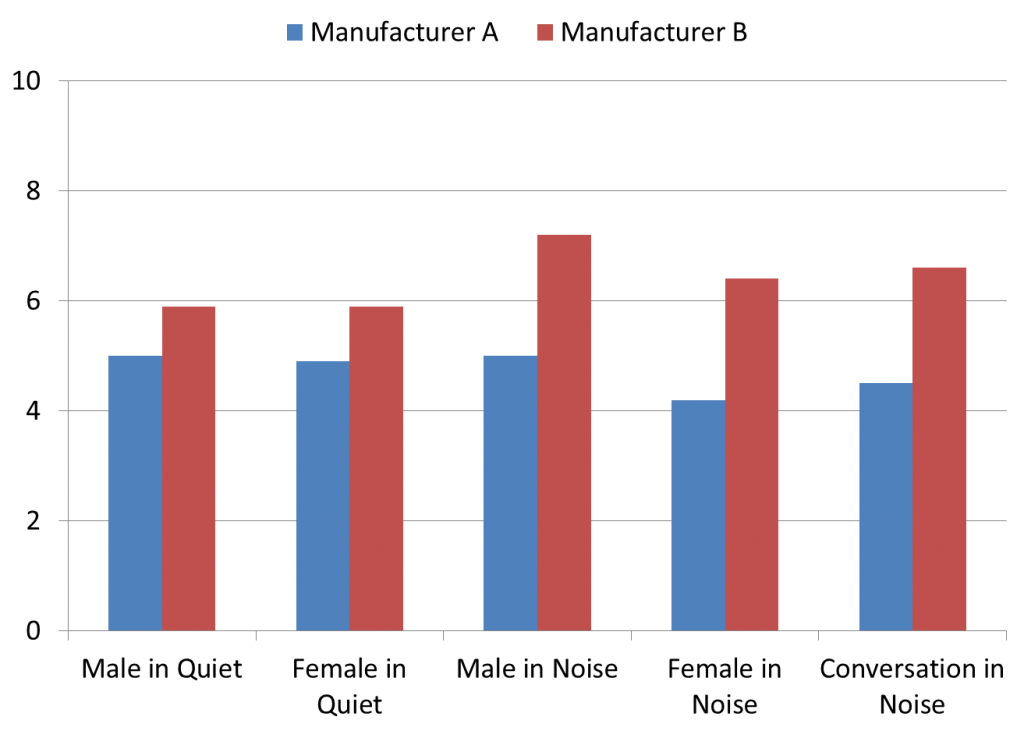
Figure 6. Mean subjective ratings of loudness for five different listening conditions, for the products of Manufacturer A and Manufacturer B. Ratings obtained using a 0-10 scale (0 = Very Soft, 5 = Just Right and 10 = Very Loud).
Analysis revealed a significant main effect of hearing aid manufacturer (p < 0.01) and a significant hearing aid setting by stimulus interaction (p < 0.05). To analyze the stimulus by hearing aid manufacturer interaction, the effect of manufacturer was analyzed separately for the speech in quiet stimuli and the speech in noise stimuli. Ratings of loudness for both speech in quiet and speech in noise, results revealed a significant main effect of manufacturer (p < 0.01); with higher loudness ratings for Manufacturer B.
To further analyze these subjective loudness ratings, raw ratings were linearly transformed by subtracting 5 from each value. The resultant values represent deviation from “normal” loudness (a #5 rating). Following this transformation, a score of −5 indicates a rating lower than normal, 0 would indicate normal loudness, and a score of +5 would indicate a rating above normal. The transformed data were analyzed using t-tests for each stimulus and hearing aid setting to test the null hypothesis that average ratings of loudness are normal (a transformed value of 0). Results revealed that ratings with Manufacturer B were significantly higher than 0 for speech in quiet and speech in noise stimuli (p <0.05). Ratings for Manufacturer A were not significantly different from 0 for speech in quiet stimuli and were significantly less than 0 for speech in noise stimuli.
These results indicate that ratings of loudness were either “normal” or “less than normal” with Manufacturer A, but “louder than normal” with Manufacturer B. If we examine individual performance, we see that for Manufacturer A, 18/20 participants (90%) rated loudness a #4, #5, or #6 (i.e., within one category of the target rating). For Manufacturer B, only 11/20 participants (55%) fell within this desired loudness range.
Overall Impression
The mean subjective ratings for the overall impression are shown in Figure 7. The participants were not given any guidance regarding what to use as a basis for these ratings, although not surprisingly, these overall preferences are very similar to the speech clarity and quality ratings shown earlier in Figures 4 and 5.
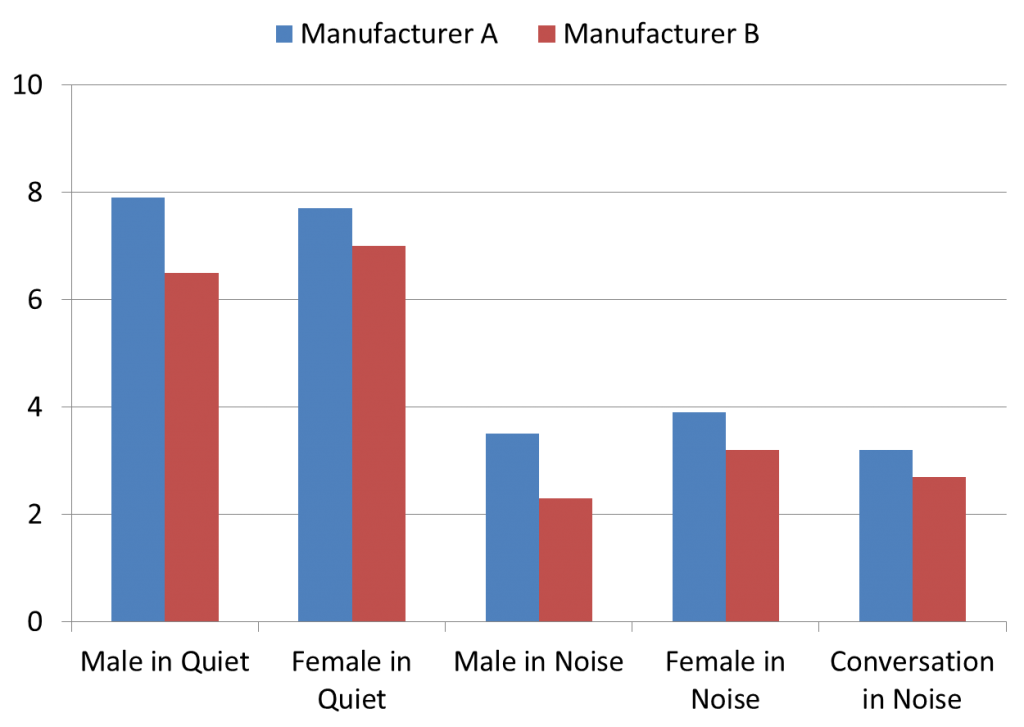
Figure 7. Mean subjective ratings of Overall Impression for five different listening conditions, for the products of Manufacturer A and Manufacturer B. Ratings obtained using a 0−10 scale (0 = Very Poor and 10 = Excellent).
Analysis of the overall impression ratings revealed a significant main effect of manufacturer (p < 0.01) and a significant main effect of stimulus (p < 0.001). The manufacturer by stimulus interaction was not significant. Multiple pairwise comparisons revealed that Manufacturer A resulted in higher ratings of overall impression than Manufacturer B (p < 0.01), and that the speech in quiet stimuli were not different from each other (p = 1.0) and the speech in noise stimuli were not different from each other (p> 0.1).
Summary of Subjective Findings
A similar trend emerged for all subjective ratings. Generally, ratings were better for Manufacturer A than Manufacturer B, since the former had ratings closer to 5 for sound clarity, quality, and overall impression. These relative patterns were similar regardless of stimulus type, although for both manufacturers, ratings of quality, clarity, and overall impression were predictably significantly better for the speech in quiet stimuli (male, female) than the speech in noise stimuli (male in noise, female in noise, conversation in noise).
Discussion and Summary
In this research, we examined two different approaches for fitting hearing aids for hearing-impaired individuals who speak a tonal language. One approach utilized a proprietary fitting based on the ILTASS (Manufacturer A), and the other approach used a fitting algorithm reported to be specialized for tonal languages (Manufacturer B). The products from both manufacturers were tested in an omnidirectional mode, and for their narrow bilateral beamforming setting.
The speech recognition findings show a small but significant difference favoring Manufacturer A, for both the omnidirectional and beamforming setting. Subjective ratings for speech clarity, sound quality, loudness and overall impression also favoured Manufacturer A, with this advantage present for five different listening conditions. Importantly, however, Manufacturer A is not the product with the reported specialized fitting for tonal languages.
We do need to point out, that the tonal algorithm itself was not independently assessed, and the benefit obtained could be related to other factors of the overall signal processing for Manufacturer A. Our intent was to simply compare two different strategies that could be used with different products when hearing aid fittings occur. What we can conclude, therefore, is that we can expect significantly better speech recognition in noise for individuals speaking a tonal language when the “algorithm + processing” of Manufacturer A is applied compared to the “algorithm + processing” of Manufacturer B, and that on average, the products of Manufacturer A will be rated superior for speech clarity, sound quality and overall loudness.
References
- Byrne D, Dillon H, Tran K, et al. An international comparison of long-term average speech spectra. J Acoust Soc Amer 1994;96(4):2108–20.