Other People’s Ideas

Other People's Ideas
Calvin Staples, MSc, will be selecting some of the more interesting blogs from HearingHealthMatters.org which now has almost a half a million hits each month. This blog is the most well read and best respected in the hearing health care industry and Calvin will make a regular selection of some of the best entries for his column, Other People’s Ideas.
I have spent the past 5 years stumbling over how to explain a certain graph to my students. It's funny because I feel I understand the graph quite well, but can never find the exact words to convey its importance when fitting hearing aids. However, to my surprise Wayne Staab discussed this graph among others in his recent blog discussing amplification for the mid-frequencies. In seeing this blog, I decided all the blogs would focus on hearing loss and hearing aids this month. Enjoy the readings and happy hearing aid fittings!
A Case for Mid-frequency Amplification?
Most individuals with hearing loss are affected mostly in the high frequencies. And, because consonants–those phonemes (distinctive speech sounds) that are believed to enable humans to differentiate one word from another–are high-frequency sounds, hearing aid fitting formulas universally call for high-frequency amplification. This continues to be a take-off of the old “audiogram fitting” approach (although with less gain, but still tending to mimic the audiogram), but those writing fitting formulas today would have a field day arguing this comparison.
Part of what I write about has to do with history related to hearing, and one part that never ceases to amaze me is that so much of what was written years ago, is still applicable today. This is especially true for topics related to psychoacoustics and acoustics. Hearing had significant contributors whose work continues to stand the test of time.
Many years ago I wrote about the significance of mid-frequencies when fitting hearing aids[1]. I was recently reminded of that article, re-read it, and found that the topic continues to intrigue me. Therefore, this post will look back to review what the “ancients” had to say about mid-frequencies, and to suggest again that we look to see if their information applies to current hearing aid fittings. Much comes from the original article.
Hearing Aid Fitting Mantra
The mantra of the late 1970s was to recommend high-frequency hearing aids not only for high-frequency losses, but even for flat losses[2][3]. A resultant problem was that acoustic feedback emerged as a major fitting concern. The feedback-reduction circuitry of today was not available then, with feedback managed by either employing a notch filter at the suspected feedback frequency region, or to roll off the high frequencies (in opposition to the intended goal).
Amplification of high frequencies is understandable, but it is a fact that hearing aid user satisfaction continues to be an issue despite the many significant hardware and algorithm improvements in hearing aids throughout the years. Is it possible that useful mid-frequency information is being ignored, even today? Many would agree that even judicious use of high-frequency amplification alone is not the answer. Might there be benefit in reviewing mid-frequency contributions again?
What is it about mid-frequencies that warrant attention, if anything?
What are mid-frequencies? For purposes of this post, mid-frequencies will be those between 500 and 2000 Hz, and certainly not above 3000 Hz.
Speech Perception
The spoken message exists in different forms in its progress from the mind of the speaker to the mind of the listener. These take the form of linguistic, physiologic, anatomic, and acoustic aspects of speech production and perception. This post will not consider all of these, but limit discussion to some of the factors that are involved at the listener’s end that are frequency related and have an impact on speech perception.
Success in recognizing and interpreting sounds depends on suprathreshold processing, which involves: intensity of the desired sounds in the ear, intensity of unwanted sounds (noise) in the ear, echoes, phase distortion, character of the speech material, reverberation, naturalness, loudness perception, spectral composition, temporal (time) factors, bandwidth, energy bands, transmissions, context, speaker, rate of speaking, and so forth.
It should be obvious that many things are important in the recognition and interpretation of speech – not just the frequency response! Still, in spite of this, and for a variety of reasons, high frequencies have been elevated to the position of significance in hearing aid fitting. What follows is an attempt to show that even time-accepted data might not support the almost blind devotion to high frequencies. What is even more interesting is that attempts to equate pure-tone hearing losses and word recognition scores seem not to provide much useful data.
Acoustic Characteristics of Speech
Frequency and energy considerations often are given substantial emphasis to justify high-frequency emphasis. These will be reviewed in terms of: (1) the average speech spectrum; (2) power, frequency, and intelligibility; (3) critical bands; (4) crossover frequency; (5) energy bands; and (6) intelligibility versus bandwidth.
Average speech spectra
The average speech spectra (energy vs. frequency) measured for men and women over a long period of time is shown in Figure 1, after Dunn and White, 1940[4]. Little difference is shown between the male and female voices. It is also obvious that most spoken energy is below 1000 Hz, and certainly below 2000 Hz, with the greatest peak energy in speech very close to 400 or 500 Hz. This suggests that frequency information in the mid-frequencies is of some importance. It is recognized that this is also the frequency region of considerable interfering noise, making amplification of this region an extremely difficult undertaking, especially when both noise and speech utilize the same frequency areas in their spectra.
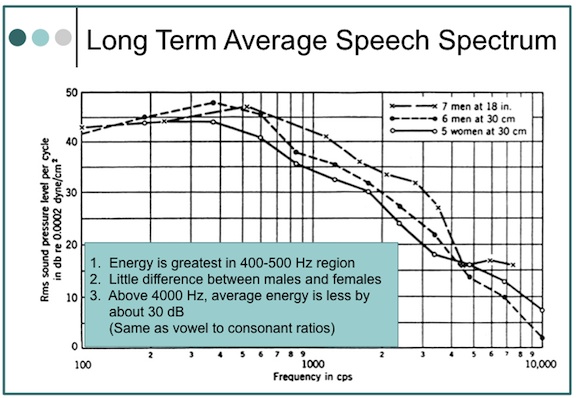
Figure 1. Average speech spectra. The overall levels, not indicated in the graph, were as follows: 18 inches in front of the seven male talkers, 75 dB SPL; 30 centimeters in front of the six male talkers, 76 dB SPL; and 30 centimeters in front of the five female talkers.
Power, frequency, and intelligibility
A. Power vs. intelligibility
The relationship of speech power to intelligibility is shown in Table 1 (adapted from Fletcher, 1929). These data have been referenced often to justify the significance of high frequencies for intelligibility. For example, from 1000 to 8000 Hz, the percent of speech power is only 5%, but contributes 60% to intelligibility. This is the usual presentation of these data. However, using the same data, 38% of the speech power and 70% of the speech intelligibility are present in the frequency range from 500 to 2000 Hz – definitely mid-frequency information by our definition.
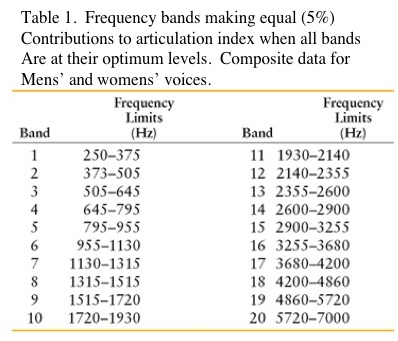 Going further, Table 1 shows the most important octave for the reception of speech to be from 500 to 1000 Hz. This contains 35% of the speech power and 35% of the speech intelligibility. Is speech power important? Hearing aid fitters would suggest that if sufficient speech power is not provided, the user does not as readily accept the hearing aids.
B. Vowel-to-consonant sound pressures
The loudest vowel [aw] as in “all,” to the softest consonant (voiceless “th”), as in the word “thin,” shows the vowel to have about 680 times greater sound pressure (ratio of 680:1), making it about 28 dB stronger (Figure 2). In the long-term average speech spectrum (Figure 1), 2000 Hz has less energy than 500 Hz by almost 35 dB. Initially, this would seem to imply that if normal conversation were to occur at 65 dB SPL, the high-frequency sounds above 2000 Hz would be softer by about 30 dB, or presented at 35 dB. The issue is complicated, however, when the intensity of a sound in free space follows an inverse-square law, which means that the intensity of a sound varies as the square of the distance. Following this law, when a listener moves to twice the distance from the sound source, the intensity will decease to one-quarter the original intensity. (If the distance is increased ten times, the intensity will be reduced to one one-hundredth the original intensity).
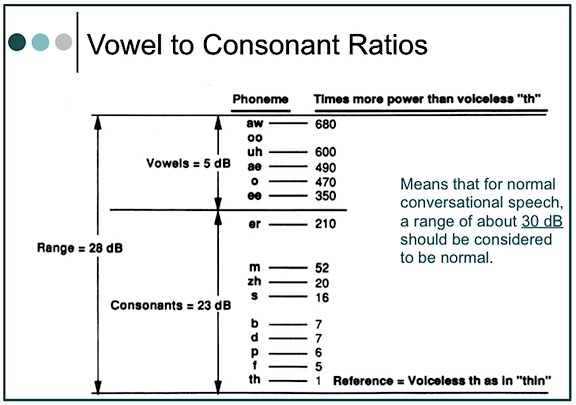
Figure 2. Ratio of vowel to consonant sound pressures. This means that for normal conversation, a range of about 30 dB should be normal. Most hearing aid fitting formulae use this range.
Fortunately, this is not what happens in a reverberant room (where most people listen), where different frequencies are emphasized (resonance) or de-emphasized, allowing high-frequency sounds to be heard more easily. Still, what is the real effect when a person has a high-frequency hearing loss? Can reverberation overcome the hearing loss as well as the overall decrease in high-frequency sound pressure, and if it can, what is the impact of increasing reverberation time on intelligibility? We know that it is not good.
Critical bands
Based on nonsense syllables
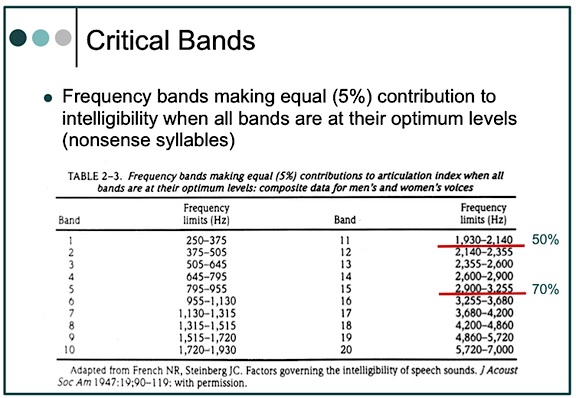
By definition, critical bands are frequency bands making equal (5%) contributions to intelligibility when all bands are at their optimum levels. Table 2 shows the critical bands developed by French and Steinberg for 20 bandwidths from 250 to 7000 Hz, and for a flat signal[5]. In these critical bands, the bands below 2000 Hz contribute a full 50% to intelligibility; and through 3000 Hz, a full 70%. It is suggested that if the bandwidths were not optimum, wider bands would be required for a given critical band. The question is, are all of the bandwidths at optimal levels in a hearing aid? In a narrow-band amplification system (what a hearing aid might be called), it might be suggested that the mid-frequencies are more likely to have optimum bandwidths, and thus contribute more to intelligibility. High frequencies are less likely to have optimum bandwidths, suggesting that a wider bandwidth is required to provide the 5% equal contribution that is shown in Table 2. However, wider bandwidths are not common in hearing aids, even today. Additionally, cochlear hearing impairment can have dramatic effects on the critical band by making it wider[6].
Based on continuous discourse
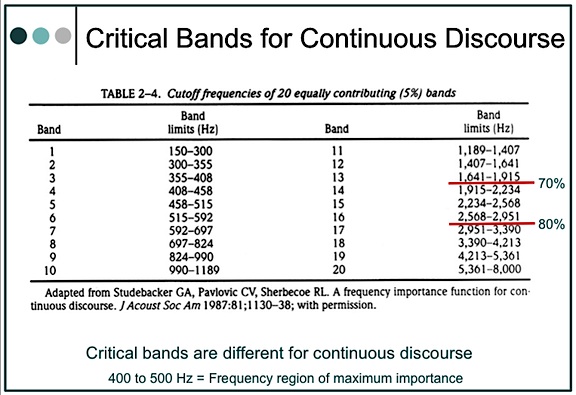
An assumption that critical bands are the same for all the speech materials has been shown not to be true[7]. Studebaker and his colleagues found that the frequency-importance function for continuous discourse (CD) was different than for nonsense syllables, and that lower frequencies were found to be relatively more important for the intelligibility of CD than for identification of nonsense syllable and other types of speech for which data are available, except for synthetic sentences.
These researchers also interpolated 20 bands of equal contribution (5%) for continuous discourse (Table 2). When compared with French and Steinberg’s critical bands, they show greater intelligibility contribution at lower cutoff frequencies (70% below 2000 Hz and 80% below 3000 Hz). When plotted for one-third octave-band-importance function (importance/dB), they found the frequency region of maximum importance at 400 to 500 Hz, with a suggestion of bimodality with relatively less importance in the 800 to 1250 Hz region.
What is the implication for hearing aid amplification? It seems to suggest that greater concentration of the mid-frequencies, especially if amplified cleanly, may improve intelligibility as much, or perhaps even more, than unchallenged concentration on the high frequencies.
Crossover frequency
The crossover frequency is the frequency that divides the auditory frequency spectrum into two parts – each of which contributes equally to intelligibility. Figure 3 shows the crossover frequency for nonsense syllables to be 1930 Hz[8]. In summarizing the crossover frequency reported by several investigators, including themselves, Studebaker et al. reported lower crossover frequencies than did French and Steinberg. For continuous discourse, they reported a crossover frequency of 1189 Hz, and stated, “Although there are exceptions, crossover frequency generally decreases as the redundancy of the test material increases.”
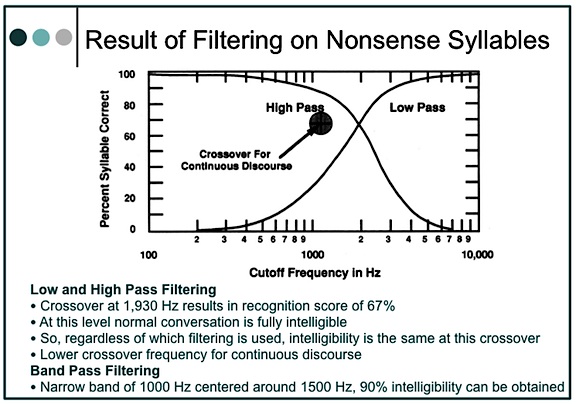
Figure 3. Crossover frequency and syllable discrimination (articulation) for high-pass and low-pass systems operating in quiet with optimal gain.
The data suggest that vocal communication is highly resistant to distortion, and that redundancy may shift the frequency of crossover even lower. Although conversation is intelligible with only the upper half of the speech spectrum, it is not unique because it can all be discarded and intelligibility can be maintained equally with only the lower half of the speech spectrum.
Important energy bands
Speech spectrograms have shown that F2 (the second formant or frequency energy region) of a phoneme is most important for intelligibility, both for normal and for sensorineural-impaired listeners with sloping audiometric configurations[9]. Formants are characteristic of vowels. Figure 4 illustrates a sound spectrogram of a phrase and identifies the phonemes. Note the definite energy (formant) regions of the vowel sounds, with the formants labeled from the bottom of the graph upward.
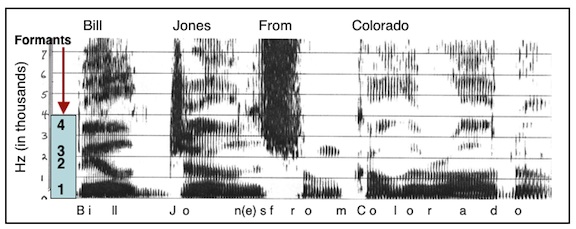
Figure 4. Speech spectrogram of the phrase.l..”Bill Jones from Colorado.” The vertical frequency scale is in kilohertz (kHz), or thousands of Hertz, and time in milliseconds is along the horizontal scale. The dark bars in the vowels, below a frequency of about 3 kHz, are due to the peaks in the spectrum caused by the three lowest formants (resonances of the vocal tract). These formants change in frequency as the speech is articulated. Above these formants is another dark bar at about 3.5 k Hz; this is due to the fourth formant – its frequency does not change greatly with articulation, as do the frequencies of the three lower formants.
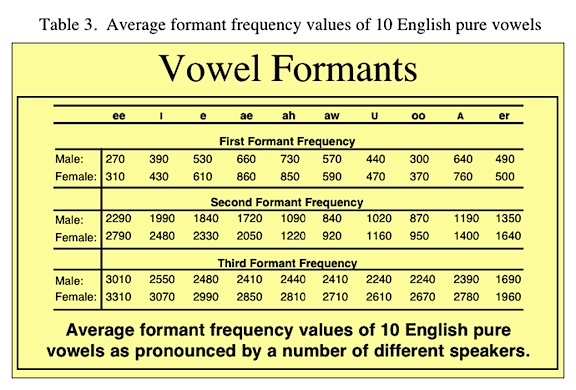
Table 3 shows the formant frequency ranges for various vowel sounds. Note that the range of F2 is from 880 to 2200 Hz. However, while F2 is considered very important, several authors recommend attenuating the first formant region to improve speech intelligibility of hearing impaired listeners[10][11].
Footnotes
- Staab, W.J. The significance of mid-frequencies in hearing aid selection. The Hearing Journal, June, 1988; 4:6-23.
- Harford E: High frequency amplification for flat audiometric configurations. Paper presented at the Annual Convention of the American Speech-Language-Hearing Association, Chicago, IL, November 1977.
- Rosenberg P, Rosenberg JR, Rosen RL, Meltzer CR: HFE regardless. Paper presented at the American-Speech-Language-Hearing Association, Chicago, IL, November 1977.
- Licklider JCR, Miller GA: The perception of speech. Handbook of Experimental Psychology. New York, John Wiley & Sons, Inc. 1951, pp. 1040-1074.
- French NR, Steinberg JC: Factors governing the intelligibility of speech sounds. J Acoust Soc Am 1947;19(1):90-119.
- Hall JV, Tyler RS, Fernandes MA: The factors influencing the masking level difference in cochlear hearing-impaired and normal-hearing listeners. J Speech Hear Res 1984. 27:145-154.
- Studebaker GA, Pavlovic CV, Sherbecoe RL: A frequency importance function for continuous discourse. J Acoust Soc Am 1987. 81 (4):1130-1138.
- French NR, Steinberg JC. Factors governing the intelligibility of speech sounds. J Acoust Soc Am, 1947. 19(11:90-119.
- Danaher E, Osberger J, Pickett.F. Discrimination of formant frequency transitions in synthetic vowels. J Speech Hear Res 1973. 16:439-451.
- Martin E, Picket J. Sensorineural hearing loss and upward spread of masking. J Speech Hear Res 1970; 13:426 – 437.
- Danaher E, Pickett J. Some masking effects produced by low frequency vowel formants in persons with sensorineural hearing loss. J Speech Hear Res 1975. 18:261-273.
A Mild Hearing Loss is Not a Mild Problem
Mild hearing loss is a misnomer. I do not know what word to substitute but mild hearing losses are not a mild problem. The data is clear. Children with mild hearing loss are at risk for academic, speech-language, and social-emotional difficulties. Newborn hearing screening does not always pick up mild hearing loss so babies with mild hearing loss may not get identified until they demonstrate delays.
Why Is Newborn Hearing Screening Missing Mild Hearing Loss?
Current standard newborn hearing screening techniques are good at identifying moderate or greater hearing loss. So when the baby passes hearing screening the family is told the baby has normal hearing. Since the parents and pediatricians have been told that the baby has normal hearing, if concerns develop, it may not occur to parents or the pediatrician that hearing loss may be a factor.
What Exactly Is Mild Hearing Loss?
The definition of mild hearing loss varies depending on the researcher so results indicating the effects of mild hearing loss vary. Some audiologists define mild hearing loss as hearing thresholds of 15-30 dB, others use 20-40 dB. Statistics vary from 1-3% of the newborn population to 54/1000 in the school population. What ever criteria is used results in a significant number of affected children. The topic cannot be ignored.
What Are the Effects of a Mild Hearing Loss?
Mild hearing loss is an invisible acoustic filter. The speech signal is not sufficiently loud and clear. Children with mild hearing loss will have less access to speech. A child with a 30 dB hearing loss will miss 25-40% of what happens in the classroom. A child with a 35-40 dB hearing loss will miss about 50% of what happens in the classroom. Bess et al, (1998) reported that 37% of children with minimal hearing loss (mild or unilateral) failed a grade by third grade.
A child with mild hearing loss will hear speech that is spoken close to the child, but when the child is 10 feet from the person talking, it will be difficult to hear. This is not an insignificant problem. More than 80% of what children learn they learn by overhearing things not specifically directed to them (incidental learning). If a child has, even a mild hearing loss, he will miss a lot of what is said, resulting in delayed language. Likely the delay will not be recognized for several years by which time we are talking about having to try and correct deficits rather then preventing delays.
Children with a mild hearing loss can be expected to have more problems hearing in noise then their typically hearing peers. Since the world is a noisy place it is not possible to avoid noise. If speech perception decreases in noise we expect a child to have language learning, and academic delays.
Middle Ear Disease?
Children with mild hearing loss can have a more significant problem from middle ear disease than children with normal hearing. Middle ear disease can decrease hearing by as much as 15-30 dB. If you have normal hearing, having a drop of 20 dB may not be a problem but if you have a hearing loss of 30 dB, an additional 20 dB drop can be devastating. Parents and physicians need to be vigilant and move quickly if a child has a mild hearing loss.
Do Children with Mild Hearing Loss Need Hearing Aids?
Audiologists do not agree on the answer to this question. I am in the group that believes we need to do whatever we can do to assure that children hear everything around them. I will do extensive testing to see how a child is hearing, including speech perception as soon as a child can do that task. If a child is having trouble hearing soft speech that is a concern, and for me, that usually means hearing aids will be beneficial. For school, children with mild or unilateral hearing losses need FM systems to reduce the negative effects of distance and background noise.
Counseling about Mild Hearing Loss
The worse thing we can say to a family is “it’s only mild.” It is not a mild problem. The data is very clear that children with mild hearing losses struggle. Does this mean they will never succeed? No, of course not. But it does mean that they will have to work harder. So let’s do what we can to make things as easy as we can. Let’s use technology and provide necessary therapy and school assistance. Our goal is to have all kids with any degree of hearing loss be able to do whatever they want to do.
The Fine Art of Demonstrating the Efficacy of a Noise-Reduction Program
In my two previous blog posts, I discussed various ways of clearly showing patients the benefits of hearing aids. I explained how to conduct demonstrations using test words and pulsed warbled test tones.
Today I want to talk about demonstrating a hearing aid’s ability to handle “background noise.” But be warned, this topic is fraught with danger. Not all patients will benefit noticeably from noise-reduction programming, and it is difficult, or even impossible, to design impressive noise-reduction demonstrations for some categories of patients. People who benefit the most from noise-reduction programming have hearing levels in the middle of the audiogram–neither near the top nor the bottom of the scale. I will explain.
If patients who have nearly normal hearing in the lower frequencies are fitted with open-canal hearing instruments, they will notice little or no difference when you switch back and forth between the normal listening program and the noise-reduction program. For these people, the perceived difference between the two programs is not enough to create any excitement. So I avoid using noise-reduction demonstrations if the patient’s low-frequency hearing is pretty good.
When you do conduct a demonstration, you want it to make the patient react emotionally. Done properly, a demonstration generates excited responses like, “Wow! That’s really impressive!” or “I can’t believe these new hearing aids can do that!”
When patients have poor hearing with thresholds near or below the bottom of the audiogram, they will probably need a lot of amplification. As a result, using directional microphones may reduce the level of amplification to an undesired point where everything sounds too soft. So I usually avoid noise-reduction demonstrations with these patients.
Reaching People with Moderate-to-Severe Loss
For this discussion of how to demonstrate noise reduction to patients, we have eliminated people with good hearing (thresholds near the top of the audiogram) and people with poor hearing (thresholds near the bottom of the audiogram). This leaves patients with moderate to severe hearing loss, i.e., with hearing thresholds somewhere in the middle of the audiogram. For example: flat hearing loss, 40-70 dB in the lower frequencies, and 60-80 dB in the higher.
Now think about this category of hearing aid patients for a moment. When their amplification is set properly, they have highly functional aided hearing. That means they are going to be able to hear and understand the words well in the demonstration we give them. Also, these patients are fitted with an occluding earmold that works as a noise plug when the hearing aid is switched to Program 2, the noise-reduction setting.
Here are the specifics of my noise-reduction demonstration:
I make sure there is a significant difference between the default program (P-1) and the noise-reduction program (P-2). This difference can be as much as 20 dB at 250 Hz (the lower frequencies).
I seat the patient in front of the speaker for my real-ear system and turn on a 70-dB composite noise. At this point in the demonstration, the patient is using P-1, which has a wide band response.
I ask the patient, “Can you hear the noise?”
He replies, “Yes. It is loud.”
I have the patient push the program button on the remote control (or hearing aid), and I ask, “How loud does the noise sound now?”
If I have adjusted the programming code properly, the patient often says, “I can’t hear the noise at all anymore?”
When this happens the patient’s family goes crazy, saying things like, “What do you mean you can’t hear that noise? Really?”
Why this Demo Works
Now, let’s study this “demo” so we understand why the hearing aid seems to be doing the impossible–eliminating all background noise.
In P-1, patients receive wide band amplification so they hear the noise “loudly.”
When they switch the hearing aid to P-2, three different factors are activated: First, the hearing aid switches into the directional-microphone mode, which substantially reduces the level of sounds coming from the area behind the patient where my “noise” speaker is located.
Second, I have markedly reduced low-frequency amplification in the noise-reduction program, so no low-frequency sound is amplified. Also, the patient has a significant hearing impairment in the lower frequencies, e.g., 40 dB, and is fitted with an occluding earmold that works as a noise plug when the aid is switched to P-2.
The first few times I did this demonstration and the patient said, “I cannot hear the noise at all,” I thought she was exaggerating. But she was not. Set properly, hearing aids can remove huge amounts of low-frequency noise coming from behind the wearer. In many cases, it seems like a miracle.
Time to Celebrate
After I do this demonstration and everyone is happy, I explain that I used a bit of “trickery.” I placed the noise source behind the patient and used a “behind-the-back, directional-microphone system.” If you do this demonstration using a noise from the front, the result is not impressive.
Nonetheless, even after I explain what I have done, patients love this demonstration. They don’t care about the specifics. From their point of view, something in the hearing aid gets rid of lots of background noise, allowing them to hear well without huge amounts of perceived noise.
Bingo! It is time to celebrate!