Programming Hearing Instruments to Make Live Music More Enjoyable

While concentrating our clinical efforts on the perception of speech in many different environments, hearing healthcare providers may sometimes overlook other signals, such as music, that may be very meaningful to the patient. Because hearing instruments are designed to focus on speech, music lovers and musicians are often disappointed by the sound quality of music. Settings and electroacoustic characteristics of hearing instruments may be ideal for speech signals, but not for music.1As a result, hearing instruments may react inappropriately when music is present, since there are many acoustic differences between speech and music.
A hearing aid that has been optimized to handle music as an input should have both software and hardware differences from other instruments. Bernafon has developed Live Music Plus, a software program with a dedicated combination of features for live music processing, which is available in its Veras and Vérité 9 hearing instrument families. In this paper we will first review some of the differences between music and speech signals. We will then explore the four elements that make up Live Music Plus, and finally we will report on the reactions of some professional musicians who have tried hearing aids with this program.
Music Is Different
Chasin2,3 and Chasin & Russo1 have pointed out a number of differences between music and speech, including these three:
(1) Speech vs. music spectra
Speech has a relatively uniform spectrum (the range of frequencies produced), since the human vocal tract is the source. The sound source is similar, even though there are differences between the voices of men, women, and children. This speech spectrum has been extensively characterized by Byrne et al.,4 and standardized as the Long Term Average Speech Spectrum (LTASS).5 The speech spectrum is used as a foundation of fitting rationales to restore the audibility of speech via amplification. Music, on the other hand, has many, highly variable sources, and the resulting spectrum can resemble noise in some cases and speech in others.1 Therefore, there is no truly representative long-term music spectrum.
(2) Different intensities
Soft speech is generally considered to be about 50 dB SPL, conversational speech around 65 dB SPL, loud speech about 80 dB SPL, and shouted speech around 83 dB SPL.2 Music, on the other hand, is quite different and can easily reach 105 dB(A)* and have peaks of up to 120 dB(A). Killion has measured peaks of a symphony orchestra in a concert hall at 114–116 dB (C).6
Speech has a well-defined relationship between loudness (the psychological impression of the intensity of a sound) and intensity (the physical quantity relating to the magnitude or amount of sound). For music this relationship may be variable and greatly depends upon the musical instrument being played.1 For example, for bass string instruments such as the cello and the acoustic bass, less gain should be applied for the lower frequencies than for speech.2
(3) Crest factor
The crest factor is the difference between the peak level and the average (RMS) level. More specifically, the crest factor is the instantaneous difference between the peak of a signal and the overall level. This can be seen in Figure 1 for a waveform of a speech signal. The dotted red line represents the peak of the signal, while the green represents the RMS level; the resulting crest factor can be seen in black.
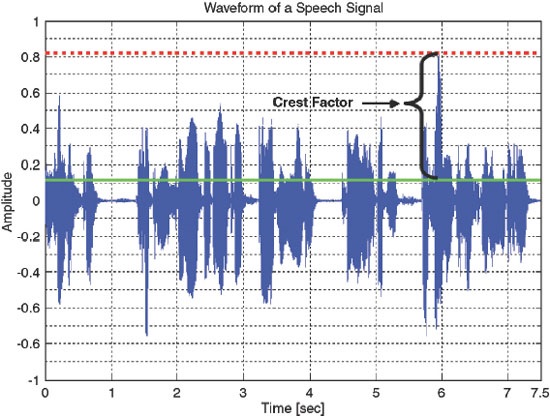
Figure 1. The RMS and peak level of a speech signal to show the crest factor.
Speech has a fairly consistent crest factor of 12 dB, while music has a crest factor of up to 18–20 dB for many instruments.2 This acoustic characteristic is very important for the dynamic impact of music.
From this very brief discussion of the differences between speech and music, it is quite easy to see why these signals must be processed differently within the hearing instrument. Now we will explore the four systems that Bernafon has implemented to improve live musical sound quality.
Live Music Plus
The four systems that make up Live Music Plus are: (1) Live Music Processing, (2) ChannelFree™ Compression, (3) wideband frequency response, and (4) microphone settings. Now let's look at each of these systems individually and how they work together.
Live Music Processing
As we discussed earlier, music has different intensities and crest factors from speech. These dynamic characteristics create a challenge to digital hearing aids. Typically, before converting the signal from the analog to the digital domain, a digital hearing aid compresses or clips the peaks of the signal when they reach 95 dB. While this is more than adequate for even loud speech, for the peaks of live music this is too low and the music will sound compressed, unnatural, even distorted. This is especially a drawback for musicians who need to hear their colleagues to play correctly. Live Music Processing increases the level to 110 dB to preserve the peaks in music before they reach ChannelFree™ processing.
Figure 2 shows a typical signal path of a hearing instrument. The acoustic signal is received by the microphone, amplified slightly, converted to the digital domain (A/D converter), and then processed. In the pre-amplifier (an AGCi), the signals are typically limited to 95 dB, while with Live Music Processing, signals up to 110 dB are allowed through to be processed by the A/D converter.
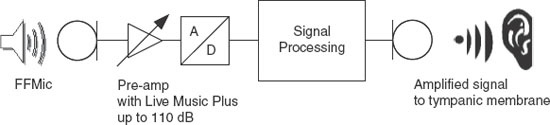
Figure 2. A basic block diagram illustrating the signal path from the microphone, to the compressor, to A/D converter, to amplifier, and finally to the receiver.
An easy way to look at the difference between the pre-amplification for a standard hearing instrument and Live Music Processing is to look at an input/output function. In Figure 3 we can see an input/output function for a 1000-Hz sinusoidal signal, with the red line representing a standard hearing instrument program designed for speech with a 95-dB SPL limit. After the 95-dB SPL input, the curve begins to level off, indicating that the instrument is compressing this signal. The blue line represents the same instrument but with Live Music Processing. In this case, the hearing aid is not compressing the signals until they exceed 110 dB SPL.
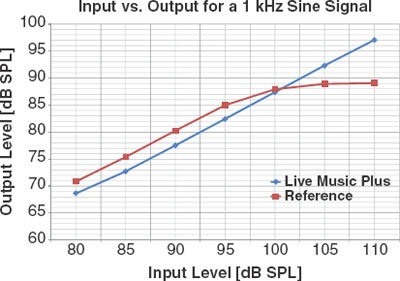
Figure 3. A comparison between the input and output functions with Live Music Processing on and off.
Pure sine wave signals are not so common in music (except electronic music), so it is important to look at the effects that have been seen so far with music. Figures 4 and 5 show amplified music displayed as waveforms with amplitude on the y-axis and time on the x-axis. In Figure 4, we see a signal processed without Live Music Plus. The peaks of the waveform are cut off, as indicated by the top red dotted line. This line signifies the maximum level that the hearing instrument will permit to be converted to the digital domain. The same signal can be seen in Figure 5 with Live Music Processing. However, here the peaks of the musical signal are preserved and the dynamic range is higher, demonstrating that the natural dynamic characteristics will be converted into the digital domain.
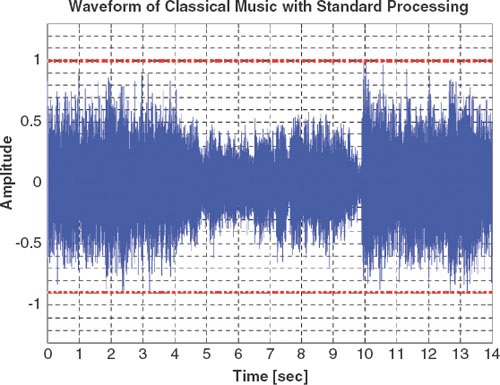
Figure 4. Amplified music soundform without Live Music Processing.
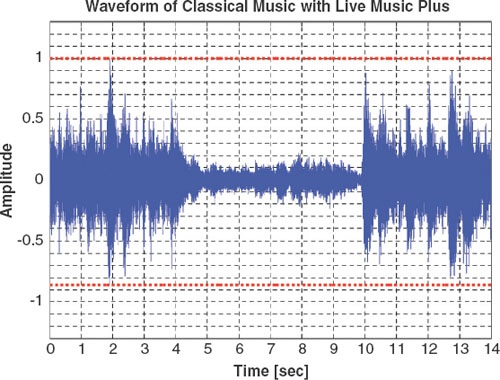
Figure 5. Amplified music soundform with Live Music Processing.
Compression system
The ChannelFree compression system has a fast processing time and treats signals as a whole to maintain the balance between low- and high-frequency harmonic energy.7–9 The high-frequency harmonics, for example, are especially important for judging the timbre (the difference between musical instruments, e.g., a trumpet and a violin, playing the same note at the same intensity). This balance is crucial for musical sound quality.
ChannelFree compression is designed to maintain the level differences between the sounds of music, thus resulting in a natural perception of the musical signal. The peaks of musical signals may be sharper than speech, as described earlier in our discussion of the crest factor, and may send a standard hearing aid into too much compression too early. However, ChannelFree compression can quickly follow the level of the signal to preserve the relationships between different levels of the musical signal, which results in a signal that is amplified to a comfortable level for the patient.
Bernafon's ChannelFree compression system has been judged to have high sound quality. A 2003 study by Dillon et al. with hearing-impaired listeners found that Symbio, a first-generation ChannelFree processing hearing instrument, received higher ratings than any of the other digital hearing aids tested, for the sound quality of piano music.10
Wideband frequency response
It is well known that a wide frequency response contributes to the perceived naturalness of music.6,11 Hearing instruments with Live Music Plus have a frequency response up to 10,000 Hz, sufficient to convey most musical sounds accurately. For example, the highest C note on a piano is 4186 Hz, while the highest C note on a violin is 2093 Hz.12
Microphone settings
For listening to music, all automatic features such as noise reduction and adaptive directionality need to be turned off. This is to prevent these systems from interpreting the music as noise or feedback, which may affect the sound quality.1 When one is sitting in a concert hall, the people seated around you often make extraneous noise. Perhaps they are explaining what is happening on stage to their neighbor or opening a candy wrapper.13
Applause can also be very disruptive for a hearing aid wearer. But Live Music Processing allows the hearing aid user to select a fixed directional-microphone setting (hypercardioid) so as to place the focus more on the stage and less on the people seated around you.
Four elements work together
To summarize, Live Music Plus combines four elements to present live musical signals accurately and enhance the experience of music for the hearing aid wearer:
- Live Music Processing to preserve the dynamic characteristics of music,
- ChannelFree processing to amplify music accurately so that it is within the wearer's dynamic range,
- A wideband frequency response to help make the music sound natural, and
- A fixed directional setting to focus on the performing musicians.
Experience With Live Music Plus
A trial was conducted in which nine professional musicians (eight males and one female) were asked to rate how the music they played sounded to them when they wore hearing aids with Live Music Plus. Four of the musicians were woodwind players (clarinet, sax, and flute), of whom three played jazz and one played classical music. Three of the musicians were classical violinists who also played the viola. The final two musicians were both rock (electric) guitarists. All were current users of occluding in-the-canal instruments with an analog K-AMP circuit.14,15
Previously, these musicians had not worn digital hearing instruments because they found the sound quality unnatural. Many musicians use analog hearing aids, such as the K-AMP, because they can handle higher level inputs and do not have an A/D converter.
The nine musicians were fitted with Bernafon Veras 9 micro-BTE hearing instruments programmed with Oasis fitting software. Eight wore non-occluding earmolds while one used fully occluding earmolds because of the degree of hearing loss.
The attribute scales used with the subjects were based on the work of Gabrielsson et al.16,17 and Cox and Alexander.18 The scales consisted of qualitative descriptions of sound quality, as shown in Table 1. Based on what he or she experienced with the hearing aids, each client gave a numerical rating to each of the five attributes in Table 1.
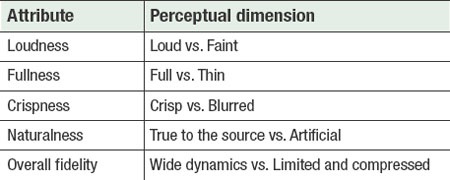
Table 1. Examples of attribute and perceptual dimension of sound quality judgement.
The results for loudness and crispness showed no significant difference between the Live Music Plus program and a multi-environment program. However, there were clear differences in the results for the other three attributes: fullness, overall fidelity, and naturalness. These are shown in Figure 6.
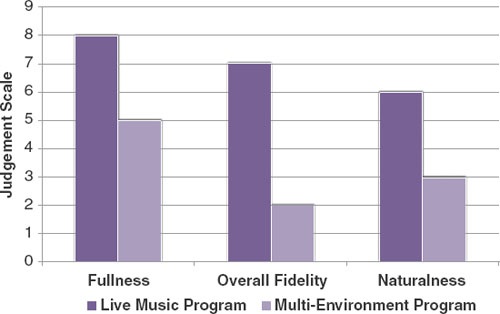
Figure 6. Judgement of test clients.
A program with Live Music Plus was judged significantly fuller (p<0.05) than the multi-environment program. Overall fidelity with Live Music Plus was judged as significantly better (p<0.05) than with the multi-environment program. There was no significant difference for naturalness between the two programs due to a large variance in the response data; however, a trend was observed (Figure 6).
The fidelity to the input signal can also be seen by measuring distortion with the musicians' instruments in a 2-cc coupler and test box. In this test, a 100-dB SPL stimulus was the input. The hearing aid was set to 5 dB of gain and the OSPL-90 was set to a very high level such that the [input + gain << output]. Any measured distortion would have been from an A/D converter that was receiving input that was outside of its operating characteristic. For more information on this test, see Chasin.19
With Live Music Plus, less than 3% of total harmonic distortion (THD) was seen, in contrast with the multi-environment program where 18%-24% (THD) was seen for very loud input signals.
Conclusions
Music differs dramatically from speech and is therefore a potential challenge for hearing instruments. Bernafon's Live Music Plus program uses a combination of elements to present live musical signals accurately to the wearer. A trial of this technology involving professional musicians suggests that music lovers, whether performers or listeners, may appreciate this program.
Acknowledgments
The authors would like to sincerely thank Jesko Lamm (Bernafon Switzerland) for his assistance with the graphics.
References
- Chasin M, Russo FA: Hearing aids and music. Trends Amplif 2004;8(2):35–47.
- Chasin M: Hearing aids for musicians. Hear Rev 2006a;13(3):11–16.
- Chasin M: Hearing Loss in Musicians: Prevention and Treatment. San Diego: Plural Publishing, 2009.
- Byrne D, Dillon H, Tran K, et al.: An international comparison of long-term average speech spectra. J Acoust Soc Am 1994;96(4):2108–2120.
- American National Standards Institute: ANSI S3.5. American National Standard Methods for the Calculation of the Speech Intelligibility Index. New York: ANSI, 1997.
- Killion MC: What special hearing aid properties do performing musicians require? Hear Rev2009;16(2):20–31.
- Schaub A: Digital Hearing Aids. New York: Thieme, 2008.
- Schaub A: Enhancing temporal resolution and sound quality: A novel approach to compression. Hear Rev 2009;16(8):28–33.
- Schaub A: Solving the tradeoff between speech understanding and listening comfort. Hear J 2010;63(7):26–30.
- Dillon H, Keidser G, O'Brien A, Silberstein H: Sound quality comparisons of advanced hearing aids. Hear J 2003;56(4):30–40.
- Moore BCJ, Tan C-T: Perceived naturalness of spectrally distorted speech and music. J Acoust Soc Am 2003;114(1):408–418.
- Levitin DJ: This Is Your Brain on Music: The Science of a Human Obsession. New York: Dutton/Penguin, 2006.
- Kramer EM: On the noise from a crumpled candy wrapper: Popular version of Paper 4pPa2, presented at Acoustical Society of America Meeting, Atlanta, 2000; online at www.acoustics.org/press/139th/kramer.htm.
- Killion MC: A high fidelity hearing aid. Hear Instr 1990;41(8), online at www.etymotic.com.
- Killion MC: The K-AMP hearing aid: An attempt to present high fidelity for the hearing impaired. In Beilin J, Jensen GR, eds., Recent Developments in Hearing Instrument Technology: 15th Danavox Symposium. Copenhagen: Stougaard Jensen, 1993:167–229.
- Gabrielsson A, Rosenberg U, Sjögren H: Judgments and dimension analyses of perceived sound quality of sound-reproducing systems. J Acoust Soc Am 1974;55(4):854–861.
- Gabrielsson A, Lindström B, Ove T: Loudspeaker frequency response and perceived sound quality. J Acoust Soc Am 1991;90(2):707–719.
- Cox RM, Alexander GC: Acoustic versus electronic modifications of hearing aid low-frequency output. Ear Hear 1983;4(4):190–196.
- Chasin M: Can your hearing aid handle loud music? A quick test will tell you. Hear J 2006b;63(12):22–24.
*The dB A scale is used to approximate what we hear as opposed to the physical sound pressure level (SPL). The dB C scale is used to measure the peaks of a signal. Both dB A and dB C filters are found on most sound level meters.
© 2010 Lippincott Williams & Wilkins, Inc. Reprinted with Kind permission from The Hearing Journal.