Other People’s Ideas

Other People's Ideas
Calvin Staples, MSc, will be selecting some of the more interesting blogs from HearingHealthMatters.org which now has almost a half a million hits each month. This blog is the most well read and best respected in the hearing health care industry and Calvin will make a regular selection of some of the best entries for his column, Other People’s Ideas.
My clinical practice has had an increase in musicians. This presents a challenge to me as I am no musician. I occasionally sing in the shower (usually late 80s power ballads; #guiltypleasure) and I have begun to dabble in playing the guitar, but a musician I am not. Music to me is about memory and emotion and until recently not much more. However, if I were to excuse my own opinions and begin to look at some of the long-term benefits, the power of music is incredible. I use music regularly with my tinnitus patients as they find it soothing.
After having the luxury of seeing Nina Kraus speak last week at the AudiologyNow conference, I would encourage everyone to check out her brainvolts website: http://www.soc.northwestern.edu/brainvolts/ to learn more about the benefits music can have on the aging adult brain. The group at Northwestern are doing some amazing work to help us further understand the difference between patient A and patient B. As this issue of Canadian Audiologist is dedicated to music, the blogs below are extremely interesting to read.
What is “Soft,” “Medium,” and “Loud” for Speech and Music?
Modern hearing aid technology has the capability to be responsive to varying levels of inputs. A hearing aid will generate significant amplification for soft level inputs, less amplification for medium level inputs, and sometimes no amplification for louder level inputs. Many people simply do not need a lot of hearing aid amplification for the louder components of speech (and music). Many hard of hearing people may say “I can hear fine if people would only speak up a bit” and they are quite correct. Understandably there has been a significant amount of research in this area for speech, but very little for music.
Figure 1 shows a sample of a single person’s speech spectrum for three speaking levels. As can be seen, as a person speaks at a higher level, it is primarily the lower frequency vowels and nasals (i.e., the sonorants) that increase in level whereas the higher frequency consonants (e.g., s, f, th, sh,…) are only slightly louder – one simply cannot utter a loud “th” as one can utter a loud “a” sound.
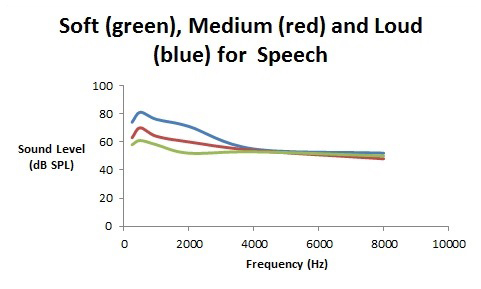
Figure 1. Spectra for soft (green), medium (red), and loud (blue) speech in dB SP.
Music is an entirely different type of input to hearing aids. Where speech can be soft (55 dB SPL), medium (65 dB SPL), or loud (80 dB SPL) especially for the lower frequency region, music can be soft (65 dB SPL), medium (80 dB SPL), or loud (95 dB SPL). Music tends to be shifted up one “loudness” category as compared with speech. There are other “statistical” differences between speech and music that involve the crest factor and other temporal features; however, a major difference is that music is louder than speech.
So far, this seems rather straight forward – for a music program, adjust “quiet” music to be like medium speech; adjust “medium” music to be like loud speech; and adjust “loud” music to be like very loud speech – perhaps subtract 5–10 dB from the amplification for a music program for loud music than what would be programmed for loud speech.
Now it gets a little bit tricky. Can we definitively say that music has well defined features for soft, medium, and loud levels? Figures 2 and 3 show the spectra for soft, medium, and loud music – Figure 2 is for reeded instruments (e.g., the clarinet, saxophone, oboe, and bassoon) and Figure 3 is for stringed and brass instruments (e.g. violin, and trumpet).
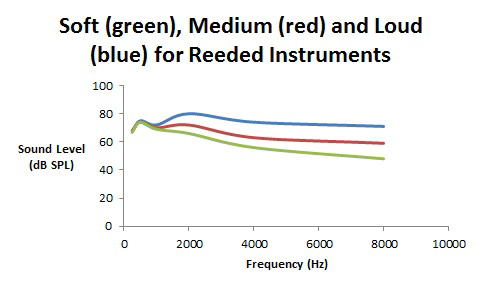
Figure 2.Spectra (in dB SPL) for soft, medium, and loud playing levels for reeded instruments such as clarinets and saxophone.
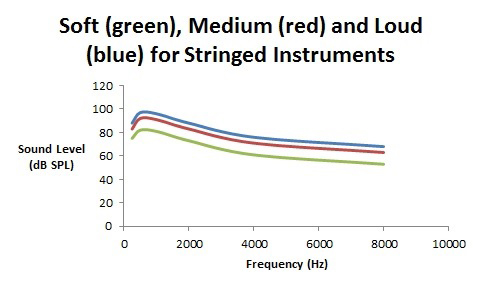
Figure 3. Spectra (in dB SPL) for soft, medium, and loud playing levels for stringed and brass musical instruments.
As can be seen, music has different properties as the playing level gets louder and these can be grouped into reeded instruments and “the rest.”
With reeded instruments, as one blows harder to create a louder sound, the reed distorts thereby providing more high frequency harmonic energy with almost no increase in the lower frequency fundamental (the note name) energy. In contrast, for stringed and brass instruments, when playing louder, it’s rather straightforward – the volume for all frequencies are turned up similarly with a maintenance of the spectral shape.
As is found with many proprietary hearing aid fitting software programs, with speech, for louder inputs, one can prescribe less low and mid frequency gain than for softer speech. The high frequency gain should be left pretty much the same for all speaking levels. For clarinets and saxophone music, for loud playing levels, the higher frequency gain can be reduced relative to softer playing levels. And for the string and brass instruments, there can be gain reduction for all frequency regions as the playing level increases.
Reprinted with kind permission from The Hearing Journal.
What do Spondees and Music (and Math) have in Common?
It is almost as if music has something in common with everything – psychology, physiology, acoustics, engineering, most areas of the arts, and now the lowly spondee.
Recently I have been reading a book on combinatorial mathematics (don’t panic – the book is written for the lay audience and not meant to conjure up memories of doing math problem sets with 4 minutes to go before they are due, and spilled coffee everywhere… ah…. memories of my distant undergraduate past). And on page 8 of the book I ran across the word “spondee”.
I quickly flipped back to the front cover to make sure that I was not reading the Handbook of Clinical Audiology by Jack Katz (6th edition), and indeed I was reading a math book.
The spondee has an interesting history spanning back to the time of the ancient Greeks (almost as old as one of my audiometers). Actually, its roots even go back to the I Ching (Book of Change) of ancient Chinese around 1100 BC. In this culture, and later the Indian culture, there was a fascination with sentence and speech prosody. In Indian culture, certain syllables uttered during Vedic chants in Sanskrit, had a certain rhythm and these involved long syllables and short syllables in a well-defined pattern.
The Vedic chants had three syllable “meters” which were based on long and short syllables. In modern terminology, we would refer to this analysis as a binary “0” and “1” combination (which is why all of this was in a math book). If a spondee is made up of two long syllables, then a math nerd would write it as (1,1), and another two syllable word that is made up of a short syllable followed by a long syllable would be written as (0,1).
So, what does this have to do with audiology and music?
This is where the Greeks came in. About the year 375 AD, some Greek Prosodists were studying their language and came out with certain long and short syllable combinations which occurred during speech, writing, and most importantly, their song of war (πνρριχη) or their song of peace. They called two short syllables in a row, a pyrrhic, and two long syllables in a row, a spondee.
Well, it wasn’t long before the Romans borrowed the Greek invention, and from Latin, eventually it came in to the English Language. Here is a partial list of terms of words (and, as we will see, music), with short syllables denoted as a 0 and a long syllable denoted as a 1.
| 0 | arsis |
| 1 | thesis |
| 0,0 | pyrrhic |
| 0,1 | iambus |
| 1,0 | trochee (choree) |
| 1,1 | spondee |
| 0,0,0 | tribrach |
| 1,1,1 | molosus |
I suppose that when the field of audiology was still in its infancy, we could have used pyrrhics for SRT testing instead of spondees, but clearly most audiology students would not have been able to spell it. I am not convinced that spondees would have been the best- an advantage of a spondee (or a pyrrhic, tribrach, or molosus) is that the peak of the nuclei of the syllables would be of similar sound levels but is this really a necessary requirement? I can see the advantage for speech awareness thresholds (such as SAT) but I don’t see why SRTs should have equally stressed syllables- so few words in every day speech has equally stressed syllables.
So where do we see spondees in music? As far back as 325 BC (I was only in elementary school back then), the book Elements of Rhythm used these terms to apply to certain combinations of musical notes. A spondee form (Spondeus) was a combination of notes starting from pairs of whole notes, and gradually increasing in playing speed over the bars to eighth notes. A pyrrhic from (Pyrrichius) was a combination of notes starting from pairs of half notes, and gradually increasing in playing speed over the bars to sixteenth notes. This terminology was carried forward until after the Renaissance and was noted in books about rhythm and prosody until about 1650. In literature, one can still see the use of the spondee in many poetic forms.
So here is one more example of the tri-linguistic roots of audiology. “Aud” is Latin, “ology” is Greek, and so is Spondee. And all together, they are English.
An 8000-Hz Audiometric Notch with Music Exposure
Last week I saw a violinist with an 8000-Hz audiometric notch in her hearing test. This is not unheard of and I have observed this clinically before, especially with violin and also some piccolo players.
Textbooks in audiology are fond of stating that any long-term damage from noise (and music) exposure tends to be restricted to the 3000–6000 Hz region, which is around the top note on a piano keyboard. The reasons for this are varied, but all are poorly understood. Essentially there are five possible explanations, and more than one of these may contribute to the finding of an audiometric notch in a certain frequency region.
- There may be a relatively poor blood supply to the part of the cochlea that corresponds to the region of 3000 to 6000 Hz.
- There may be a greater susceptibility to damage to the hair cells and supporting structures in this frequency region.
- The orientation of the stapes footplate into the cochlea is such that its primary force vector aims towards those hair cells in this region, with eventual failure due to hyromechanical action (i.e., the 8000 Hz and above region is in the lee of the hydromechanical “storm” that is set up in the cochlea).
- The area of hearing loss is greatest depending on the energy content of the offending noise/music spectrum.
- Permanent hearing loss from long-term noise/music exposure has its greatest effect approximately half an octave above the peak of the noise/music spectrum, which tends to be in the 3000–6000 Hz region.
Each of these possible explanations has a wealth of literature supporting it, especially the last three possibilities. It is not unusual to see a very large man with a 3000 Hz audiometric noise notch where his ear canal is so long that it resonates at 2400 Hz. One half octave above 2400 Hz is about 3500 Hz, and since only 3000 Hz and 4000 Hz are typically assessed, it is possible to obtain an audiogram with the poorest acuity around 3000 Hz. In contrast, I cannot remember ever seeing a relatively small person (with a shorter ear canal that resonates at close to 3000 Hz) having an audiometric notch at such a low frequency. Most musicians have a 6000 Hz audiometric notch rather than at 3000 Hz or at 4000 Hz. Many musicians are simply not as large as NFL football players or long-distance truckers.
Of course, the correlation between apparent physical stature and frequency location of an audiometric noise/music notch is nowhere close to 100%, yet there is some correlation.
What this may effectively mean is that those people with a shorter ear canal (and associated higher resonant peak) would have greater “amplification” of the environmental noise before it even reaches their cochlea, and this may result in a higher frequency audiometric notch than if this natural outer ear resonant frequency was lower.
The nature of the energy distribution in the offending noise/music spectrum – the fourth possible explanation stated above – has not been well investigated. In 1983 Mills and his colleagues performed a study that showed that for very low frequency (below 500 Hz), high-intensity stimuli, the greatest region of temporary threshold shift (TTS) would be in the 300–750 Hz region. While it can be argued that TTS is not the same as permanent hearing loss (PTS), something is definitely happening in this low-frequency region that is noise/stimulus related.
To date, there is little research to indicate treble musical instruments (or occupational noise environments) cause a reduction in hearing acuity that is greatest in the region above 6000 Hz, but given the Mills et al. (1983) data and the clinical occurrence of 8000 Hz notches with some violinists and piccolo players, there is some reason to investigate this “upper bound” of 6000 Hz for long-term noise/music exposure. This would make for an interesting Capstone essay for some intrepid AuD student.
One possible reason why this has not been widely reported in the literature is that a typical audiometric assessment only extends up to 8000 Hz, and unless 10,000- or 12,000-Hz hearing acuity is assessed, any dip in the 8000-Hz region may not be recognized as a notch, and may incorrectly be attributed to earphone placement, presbycusis, or the presence of cerumen in the ear canal.
Clinically I do test up to 12,000 Hz, especially with musicians. As shown by the work of Michael Stinson and his colleagues a test frequency of 12,000 Hz is just at the edge of suffering from calibration problems which are well-understood with high-frequency audiometry, but the variability is still good up to 12,000 Hz; the problems typically arise above 12,000 Hz.
One can argue (and I would tend to do so) that testing at 10,000 Hz and 12,000 Hz is a waste of clinical time. It may help define an 8000-Hz audiometric notch, but other than being of academic interest, I see no clinical value in it. I must admit that I do test these frequencies out of my personal academic curiosity, but I acknowledge that it will not alter what I will be able to offer the musician who has an audiometric notch at 8000 Hz as opposed to the more “conventional” 3000–6000 Hz region.